There are basically two main categories of charts: 2D and 3D charts. For each category, there are several types:
- 3D Histogram, Pie, Doughnut, Strips
- 2D Histogram, Pie, Lines, Legend
To edit a linked chart:
1. Double click on the chart
or
2. Right click on the chart to open the context menu and click on "Redesign Multichart Linked to grid"
When the Chart Dialog opens up, it is important to know how to move and resize the charts:
Move: Ctrl Drag
Resize: Mouse wheel
For 2D charts: Ctrl-Right Drag
Font resize: Use the chart dialog or, for quick global font changes, there are two buttons on the designer
Rotation (3D charts): Drag
Dialogs
There are 2 main dialogs:
1. Section and Colors: This is shared among charts and controls the measures and values that are represented. Here you can select or deselect the measures or the values that have to be displayed. Also, colors of the single values can be adjusted.
2. Properties: This dialog is chart-specific. There is one different dialog for each chart type and it controls properties that are specific of each chart.
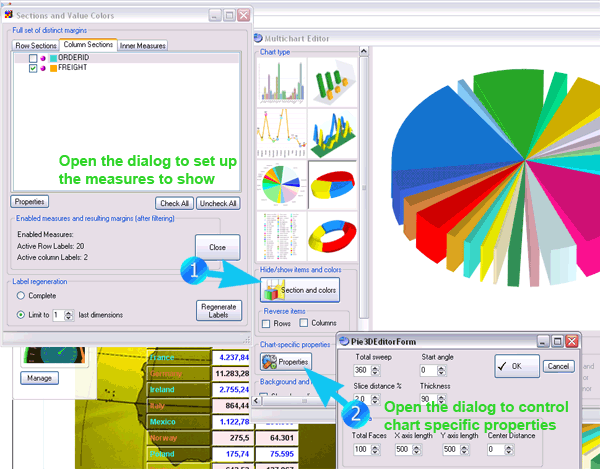
For each chart there are several properties which can be set and that can affect the shape, orientation, lighting of the chart. We leave to the use to make experiments and find out about them. Let your creativity flow.
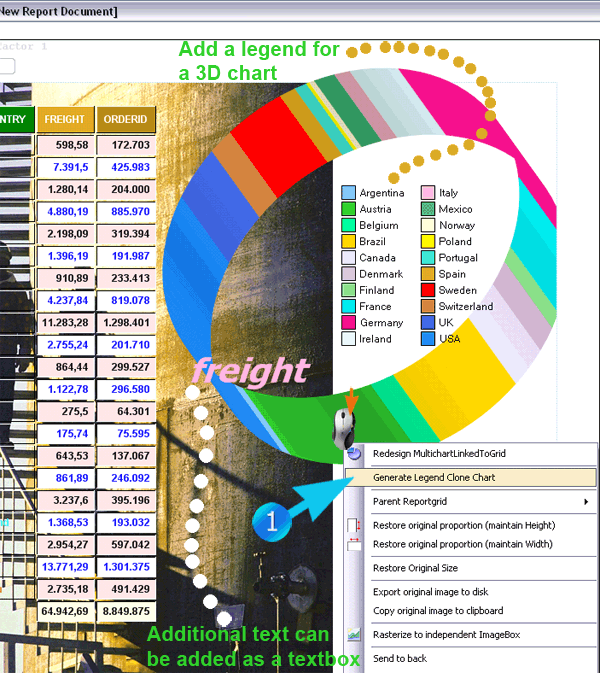
Legend for 3D charts
To add a Legend to 3D chart type, right click on the chart to open the context menu and click on "Generate Legend Clone chart". This is actually just a shortcut to create a chart based on the same data, but with a different type (legend type). In fact we consider, conceptually, a legend like another chart type, and not an accessory of a chart.